MEP Rework Costs: How Much Are You Really Losing?
Construction rework — demolishing and rebuilding work that was installed incorrectly — is the largest avoidable cost on most MEP-intensive construction projects. Industry data places rework at 2–20% of total project cost, with the Construction Industry Institute (CII) reporting an average of 12% and most studies clustering between 5–12% (CII; PlanRadar 2025 meta-analysis; Navigant Construction Forum).
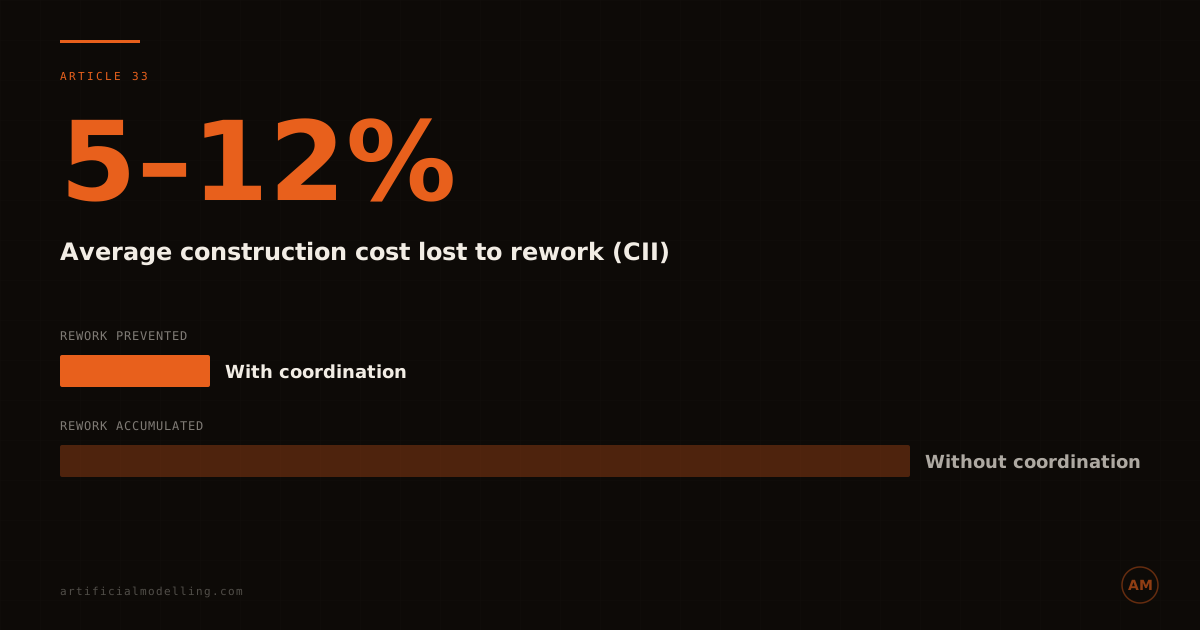
Construction rework — demolishing and rebuilding work that was installed incorrectly — is the largest avoidable cost on most MEP-intensive construction projects. Industry data places rework at 2–20% of total project cost, with the Construction Industry Institute (CII) reporting an average of 12% and most studies clustering between 5–12% (CII; PlanRadar 2025 meta-analysis; Navigant Construction Forum). On MEP-intensive projects — data centres, hospitals, pharmaceutical — where coordination failures drive a disproportionate share of rework, the percentage typically sits at the higher end. On a €30 million project, even a mid-range 8% rework rate represents €2.4 million.
These figures are not theoretical. They represent actual project expenditure on work that was done twice: once incorrectly and once correctly. The labour, materials, equipment, and time consumed by the first installation are entirely wasted.
Rework is also a primary driver of cost growth. Research by Professor Peter Love (Construction Management and Economics) found that rework was responsible for 52% of total cost growth on the projects studied — meaning more than half of all budget overruns were attributable to work that had to be done twice. On a project where each week of delay costs €100,000–€250,000 in general preliminaries and liquidated damages, the delay cost from rework often exceeds the direct rework cost.
Where Rework Costs Accumulate
MEP rework falls into four cost categories:
Direct rework cost: The physical demolition and rebuilding of incorrectly installed work. A ductwork reroute that requires removing 20 metres of installed ductwork, modifying supports, fabricating new sections, and reinstalling costs €10,000–€30,000 per incident. A cable tray reroute costs €3,000–€10,000. A pipework reroute with welded joints costs €8,000–€25,000.
Material waste: Removed components are rarely reusable. Cut ductwork, modified pipe sections, and repositioned cable tray become scrap. Material waste from MEP rework adds 3–5% to the material cost of the affected systems.
Programme impact: Every rework incident disrupts the installation programme. The affected trade stops work in the rework zone. Trades following in the installation sequence are delayed. The programme absorbs the delay or compresses subsequent activities — both of which increase cost.
Consequential costs: Subcontractor disruption claims, revised design fees, additional quality inspections after rework, and extended supervision and preliminaries all add to the total rework cost. These consequential costs typically equal 30–50% of the direct rework cost.
The Cost Per Clash
The cost of resolving a single clash varies dramatically depending on when it is discovered:
| Discovery Stage | Resolution Cost | Time Impact |
|---|---|---|
| In the BIM model (during coordination) | €50–€200 | Minutes |
| During fabrication (before installation) | €500–€2,000 | Hours |
| During installation (on site) | €5,000–€25,000 | Days |
| During commissioning (after installation) | €10,000–€50,000 | Weeks |
| During operation (after handover) | €20,000–€100,000+ | Months |
The cost escalation from model to operation is 100–500×. A clash that costs €100 to resolve in the BIM model costs €10,000–€50,000 to resolve on site. This ratio is the fundamental economic argument for BIM coordination.
The Prevention Equation
BIM clash detection reduces design errors by over 70% (multiple academic studies; CII; IJCRT 2025). On a project with an estimated €3 million rework budget (10% of €30M), coordination that prevents 70% of coordination-related rework (estimated at 50% of all rework) saves:
€3,000,000 × 50% (coordination-related) × 70% (prevention rate) = €1,050,000 saved
The coordination fee for the same project: €100,000–€250,000.
The ROI: 4–10× the coordination investment.
On one documented case — Haskell's €210 million design-build project — a €185,000 BIM coordination investment generated €2.4 million in avoided rework, a 10× return (Haskell case study, cited in Construction Management and Economics).
FAQ
What percentage of construction cost is rework?
Industry data places construction rework at 5–12% of total project cost on average (CII, PlanRadar 2025 meta-analysis), with the full range spanning 2–20%. On MEP-intensive projects (data centres, hospitals, pharmaceutical), the percentage skews toward the upper end due to the density of services and the complexity of systems.
How much does a single MEP clash cost to fix on site?
Resolving a single significant MEP clash on site costs €5,000–€25,000 in direct rework, plus programme impact. The same clash resolved in the BIM model costs €50–€200. The escalation factor is 100–500×.
Does BIM coordination eliminate all rework?
No. BIM coordination eliminates coordination-related rework — clashes between building services and between services and structure. It does not eliminate rework from workmanship defects, material defects, or client-driven changes. However, coordination-related rework is typically the largest single category.
Artificial Modelling prevents MEP rework through fixed-price BIM coordination. Every euro spent on coordination prevents €4–€10 in rework. See the numbers →